


Abstract
Background
Vitamin D is an essential nutrient that supports normal immune function, but many people have insufficient levels. Recent studies have found a strong association of serum vitamin D with rate and/or severity of Covid-19 infections.
Methodology
Forty adults with current or recent Covid-19 infections, verified by SARS-CoV-2 (severe acute respiratory syndrome coronavirus 2) polymerase chain reaction (PCR) test, were enrolled in a study to measure levels of vitamin D and other nutrients. Seven participants with low levels of vitamin D (defined as serum 25-hydroxy vitamin D [25(OH)D] below 30 ng/mL) and active Covid-19 infection received supplemental vitamin D3 (10,000 IU/day for 2 weeks, followed by 5,000 IU/day for 3 weeks) in an open-label pilot study.
Results
Participants with low vitamin D experienced longer duration of symptoms (22.1 ± 13.5 vs 14.0 ± 9.6 days, P=0.05) and higher severity of 2 symptoms: cough and shortness of breath/difficulty breathing (1.0 ± 0.9 vs 0.5 ± 0.5 [P=0.02] and 1.2 ± 1.2 vs 0.5 ± 0.5 [P=0.01], respectively). All other individual symptoms were also more severe in the group with low vitamin D, although the difference was not significantly different for those symptoms. Seventy-eight percent of participants tested positive for SARS-CoV-2 antibodies, and those participants had a significantly higher worst-overall symptom severity (2.0 ± 0.9 vs 1.3 ± 0.5, P=0.01) than those who did not test positive. Participants had unusually low levels of vitamins A (and related carotenoids), C, E, and MK-7 compared to laboratory reference ranges, but normal serum zinc levels. Vitamin D supplementation was well-tolerated and significantly raised serum 25(OH)D from 26.3 to 41.4 ng/mL after 2 weeks.
Conclusion
Low levels of vitamin D are associated with longer duration and worse severity of Covid-19 infections. Supplementation with vitamin D and high doses of other nutrients (vitamins A, C, E, K) should be investigated.
Introduction
Coronavirus disease 2019 (Covid-19) has become a severe public health crisis worldwide and is now the 4th leading cause of death in the US.1 Several risk factors for Covid-19 are also associated with substantially lower vitamin D levels, including darker skin, older age, and obesity. Of the many preexisting conditions that increase the risk and/or severity of Covid-19 infection, one of the most easily treatable is vitamin D deficiency.
Vitamin D deficiency is common in the United States and worldwide. According to the Centers for Disease Control and Prevention (CDC),1 32% of the US population has deficient (<30 nmol/L) or insufficient (30–50 nmol/L) vitamin D levels. Per the Endocrine Society’s criterion,3 over half of the US population has vitamin D deficiency (20 ng/mL) or insufficiency (21–29 ng/mL).
According to Bailey et al, using a food frequency questionnaire (FFQ) 24-hour recall, only 23% of US adults aged 19 years or older met the Adequate Intake of vitamin D from diet alone, while 42% of adults met Adequate Intake when considering supplemental intake in addition to diet.4 Only 37% of the US population consumed vitamin D supplements.4
Vitamin D plays many important roles in the body, including modulation of innate and adaptive immunity. Higher vitamin D levels are associated with lower risk of acute respiratory distress syndrome (ARDS).5 Similarly, many studies have found that low vitamin D levels are strongly associated with increased risk and/or severity of Covid-19 infections.
Several epidemiological studies found lower vitamin D levels to be associated with higher incidence of and/or higher mortality from Covid-19.6,7 Four studies have found an inverse relationship between 25(OH)D levels and incidence and/or severity of Covid-19 infection.7-10
At the onset of this investigation, there had been a handful of randomized, controlled trials (RCTs) involving vitamin D supplementation for patients with Covid-19.11-21 These studies consistently found that vitamin D supplementation was significantly beneficial in reducing Covid-19 incidence, severity, and/or mortality. Yet Murai et al didn’t find a reduction of hospital duration with a bolus dose of vitamin D.22
Therefore, we decided to conduct a pilot study to measure vitamin D status, as well as the levels of other nutrients, in adults with recent or current SARS-CoV-2 infection and enroll those with low vitamin D and current Covid-19 symptoms in an open-label clinical trial of vitamin D3 supplementation.
Materials and Methods
Study Design
Institutional review board (IRB) approval: The IRB of Sonoran University of Health Sciences approved this study, and the IRB of Arizona State University defered to the Sonoran University IRB. The study was prospectively registered on clinicaltrials.gov (NCT04407286). Investigators explained the study to applicants, and all participants signed informed consent documents.
Study design: The study involved 2 parts. Part 1 involved initial measuring of vitamin D levels (as serum 25(OH)D) and other biomarkers in adults with current or recent SARS-CoV-2 infections. Part 2 involved subsequent treatment with vitamin D3 for those who had low serum 25(OH)D and who still had Covid-19 symptoms.
After testing, we split participants into 2 groups. Group A included participants with “normal” levels of vitamin D (defined as serum 25(OH)D ≥ 30 ng/mL) and participants who had recovered from Covid-19. We followed the former every 2 weeks for up to 6 weeks or until they recovered, whichever occurred first, to assess their final symptom severity.
Group B included participants with lower levels of vitamin D (defined as serum 25(OH)D<30 ng/mL) and current Covid-19 symptoms. We invited them to participate in an open-label clinical trial of vitamin D3 supplementation. The dose for the first 2 weeks was 10,000 IU/day, and then we remeasured levels. In all cases, the remeasured levels were in the range of 30 to 50 ng/mL, so in all cases the dosage for the last 3 weeks was 5,000 IU/day.
Study Participants
The inclusion/exclusion criteria were:
Inclusion Criteria for Part 1 (Testing):
- Adult aged 18 or more
- Able to communicate clearly in English
Exclusion Criteria for Part 1 (Testing):
- Aged less than 18 years
- Unable to communicate in English
- Negative Covid-19 test
Participants were enrolled in the study from June 3, 2020, to August 16, 2020.
Data Collection: Survey Questions/Severity Definitions
Participants completed a questionnaire about their overall worst illness severity and current overall severity, using a scale based on a previous one.23,24
Dropouts
As described in Figure 1, we enrolled 41 participants in the study and then removed 1 who did not complete the initial medical history; thus, analysis was done on 40 participants. Of those, 22 reported current symptoms at the time of their enrollment in the study and continued follow-up symptom surveys every 2 weeks until they had recovered.
Of the 7 participants enrolled in the treatment study, 1 dropped out for unknown reasons and did not complete the 2-week follow-up blood draw and follow-up survey.
Adjusted 25(OH)D
At the start of their Covid-19 infection,15 participants were not taking any vitamin D; 17 participants were taking a stable dose of vitamin D prior to their Covid-19 infection; and 8 participants began taking vitamin D or increased their dose shortly after becoming ill or receiving a positive test for Covid-19. For 5 of the 8 participants who modified their dose, the increase in vitamin D was modest and taken only for a short time, so we estimated their adjusted 25(OH)D level at the time of the start of their infection using the following algorithm: adjusted vitamin D at time of infection = measured 25(OH)D – [(daily vit D supplementation in IU) * (1 ng/mL)/10,000 IU) * (number of days taken)]. We used this simple approximation because our clinical experience suggests that 10,000 IU of oral vitamin D increases serum levels by about 1 ng/mL per each day taken. These adjustments were small, ranging from 2.3 ng/mL to 4 ng/mL. However, 2 participants took a higher dose and/or had a longer duration, so we did not include their results in analyses reporting levels of “adjusted 25(OH)D.”
Statistical Analysis
We made comparisons between groups using a t-test due to the small sample size, with P<0.05 accepted as statistically significant. We used a paired t-test for comparisons for the same individual (such as pre/post comparison of 25(OH)D levels). We calculated correlations in Excel 365 using the function CORREL, which calculates Pearson’s Correlation. Because this is a pilot study, there was no correction for multiple hypothesis testing, so all results need to be interpreted cautiously as preliminary results requiring further validation.
Laboratory Methods
LabCorp performed many tests including SARS-CoV-2 antibody immunoglobulin G (IgG), vitamin D 25-hydroxy, serum zinc, a comprehensive metabolic panel, and a complete blood count with differential. In addition, samples were processed at Health Diagnostics and Research Institute (HDRI) in New Jersey for further testing. These tests included measuring serum levels of vitamin A, vitamin A–related carotenoids, vitamin E, vitamin C, vitamin K1, and vitamin K2 (MK-4, 7, 8, 9), as well as coenzyme Q10.
Results
Table 1 lists the demographics of the patients (n=39 after accounting for the 2 who did not finish). The participants were primarily female (69%) because we mainly advertised for the study on Facebook, and the viewers of the ads were primarily women. The average participant age was 38 years (range 21–61 years). The participants all had a positive test for SARS-CoV-2 in the last 4 months prior to enrollment (average=26 days, median=19 days). At the time of enrollment, 16 participants had recovered from their Covid-19 infection, 22 had current Covid-19 symptoms, and 1 participant was asymptomatic (with a positive SARS-CoV-2 test 15 days previous to their blood draw). Three participants reported having been hospitalized during their illness, and the average hospital stay for these individuals was 6 days. Two of these participants reported being on supplemental oxygen during their hospital stay. Of the participants admitted to the hospital, none were admitted to the intensive care unit (ICU), none were on a ventilator, and all had recovered from Covid-19 at the time of enrollment into the study.
Table 2 reports the ranges for measured (unadjusted) serum 25(OH)D levels at enrollment. Of the 39 participants tested, 23 had serum 25(OH)D levels below 30 ng/mL, and 7 of those had current Covid-19 symptoms and met the criteria for treatment and were enrolled in the treatment arm of the study (see Figure 1). Eight other participants had current Covid-19 symptoms at the time of their blood draw, but there was up to a 1-week delay in obtaining their 25(OH)D results due to an unusually high demand for lab services at that time, so by the time we obtained the results, those participants had mostly recovered from their Covid-19 symptoms and did not qualify for treatment.
Worst Overall Severity
Table 3 reports the severity for the groups with low and normal 25(OH)D (≥30 ng/mL). Worst overall severity was defined as the worst severity during the entire Covid-19 infection, and it was rated on a 7-point scale: 0=asymptomatic, 1=mild, 2=moderate, 3=severe, 4=hospitalized, 5=hospitalized in ICU or hospitalized with supplemental oxygen, 6=death. The average overall worst severity of 37 participants’ Covid-19 illness was of mild-moderate level (1.9 ± 1.0). There was no significant correlation (r = –0.09) between overall worst symptom severity and adjusted 25(OH)D serum levels. Interestingly, the participant who was asymptomatic had a high normal level, 41 ng/mL.
We compared the average severity of all the primary symptoms and the average severity of all the secondary symptoms for those with serum 25(OH)D levels below and above or equal to 30 ng/mL. Of the 37 participants included in the statistical analysis, those with low adjusted serum 25(OH)D < 30 ng/mL had slightly worse primary symptoms and secondary symptoms (listed in table 6) than those with normal levels of serum 25(OH)D (0.71 ± 0.8 vs 0.30 ± 0.4, P=0.03 for primary; 0.90 ± 0.5 vs 0.65 ± 0.4, P=0.08 for secondary).
When we considered individual symptoms, the group with low 25(OH)D reported more severe symptoms for all 18 symptoms in comparison to the group with normal 25(OH)D levels (see Table 6), and for 2 symptoms (shortness of breath/difficulty breathing and coughing), the difference was statistically significant (1.0 ± 0.9 vs 0.5 ± 0.5, P=0.02, and 1.2 ± 1.2 vs 0.5 ± 0.5, P=0.01, respectively). Similarly, serum levels of 25(OH)D had the strongest correlation with increased severity of shortness of breath (r= –0.36, P<0.05) and cough (r= –0.28, P<0.1). Although the difference in symptom severity between groups was not significant for most symptoms, every primary and secondary symptom was worse in the group with low serum 25(OH)D.
Duration of Symptoms
There was a wide variation in duration of symptoms, from 0 days (asymptomatic) to 60 days, with an average of 20 ± 13 days and a median of 17 days. The group with low adjusted 25(OH)D had longer duration of symptoms than the group with normal adjusted 25(OH)D (22.1 ± 13.5 vs 14.0 ± 9.6, P=0.05).
Antibodies
Of the 37 participants included in this analysis, 28 tested positive for SARS-CoV-2 antibody IgG, and 9 tested negative. Participants who tested positive for antibodies had higher measured (unadjusted) serum 25(OH)D levels (30.3 ± 10.4 ng/mL vs 26.5 ± 4.0 ng/mL, P=0.11).
Factors Affecting Vitamin D Levels
Obesity
As in previous studies, we found that baseline levels of measured (nonadjusted) 25(OH)D were inversely correlated with body mass index (BMI; r= –0.46, P<0.01) and body weight (r= –0.42, P<0.01). The BMI range was from 20.4 to 53.8, with an average of 30.3 ± 7.6; and the weight range was 125 to 347 Ibs, with an average of 191.6 ± 49.2 Ibs.
Effect of previous vitamin D supplementation
Of the 39 participants in the pilot study, 15 were taking no vitamin D, 8 were taking a vitamin D supplement that was less than or equal to 1,000 IU per day (average=623 IU/day), and 16 were taking supplemental vitamin D at a dosage of greater than 1,000 IU/day (average=3,864 IU/day). The average levels of serum 25(OH)D for the groups taking little or no vitamin D and the group taking more than 1,000 IU/day were 27.0 ng/mL ± 9.0 and 35.0 ng/mL ± 8.9, respectively.
Effect of clinical trial of vitamin D supplementation
The 6 participants who received vitamin D3 supplementation in the open-label clinical trial, dosing of 10,000 IU/day for 2 weeks, had a substantial increase of serum 25(OH)D levels, from 26.3 ± 2.6 ng/mL at baseline to 41.42 ± 2.9 ng/mL at 2 weeks (P=0.000003), an increase of approximately 15.1 ± 0.9 ng/mL. The initial range of levels was 23.4 to 29.7 ng/mL, and the final range was 38.7 to 45.9 ng/mL.
The participants’ symptoms were mild or moderate at the start of treatment, and none became severe. Participants tolerated the supplementation well without any reported adverse effects.
We analyzed 1 participant separately because she had been taking 50,000 IU of vitamin D2 weekly for 10 years. Despite this, at the time of her blood draw, her serum 25(OH)D levels were low (24.9 ng/mL). She stopped the D2 weekly dose and had 2 weeks of treatment with 10,000 IU of D3/day, and her serum 25(OH)D level increased to normal levels (31.8 ng/mL), an increase of 6.9 ng/mL. This is consistent with a Binkley 2011 study25 that found that supplementation with vitamin D3 was substantially more effective in increasing levels of 25(OH)D than supplementation with vitamin D2.
The vitamin D3 supplementation did not significantly affect any values from the complete blood count with differential. The only changes on the metabolic panel were decreases in elevated liver enzymes (alanine transaminase [ALT], aspartate transaminase [AST]) in some participants, but none were statistically significant.
Other nutrients
Table 4 shows the results of the blood levels of other nutrients at baseline. The participants had unusually low levels of vitamin C, vitamin A (retinol), and 6 different vitamin A–related carotenoids; this is consistent with a high level of oxidative stress, which is known to occur during Covid-19 infections. Participants had high levels of vitamin K1 but unusually low levels of MK-7 (1 of the variants of vitamin K2).26 Zinc levels were in the normal range, and levels of coenzyme Q10 were often above the reference range.
Discussion
Overall, the data suggest that there is a strong association between serum 25(OH)D levels and the severity and duration of symptoms. There was no correlation observed between worst-overall symptom severity and serum 25(OH)D levels for the entire group, but there was a significant inverse association of 25(OH)D levels and severity of 2 primary symptoms, cough (P=0.02) and shortness of breath/difficulty breathing (P=0.01). Also, the group with normal 25(OH)D had lower severity of every primary and every secondary symptom, though the difference was not statistically significant for most symptoms.
The low levels of vitamins C, E, and A and many carotenoids (which can be converted to vitamin A) suggest a pattern of increased oxidative stress and a need for substantial increases of those nutrients to restore normal levels.
Higher levels of 25(OH)D were also associated with a much shorter duration of Covid-19 symptoms (22 days vs 14 days).
Participants with positive antibodies had higher serum 25(OH)D levels. This finding suggests that higher vitamin D levels support greater antibody production. A 2023 study by Cesur et al supports that association.27
At baseline, the group taking approximately 1,000 IU/day or more of vitamin D (averaging 3,546 ± 2,296.9 IU/day) had a higher level of serum 25(OH)D than the group taking less than 1,000 IU/day (averaging 142 ± 284.2 IU/day): 33.9 ± 8.9 ng/mL vs. 27.13 ng/mL. This suggests that 3,500 IU/day for an extended period is associated with a serum increase of 7 ng/mL, which is helpful, but many people needed a higher dose to achieve and maintain levels above 30 ng/mL. This is consistent with other studies that suggest people need substantial doses of vitamin D to increase levels of 25(OH)D, especially if they have a higher BMI.28,29
On average, supplementing with 10,000 IU of vitamin D3 for 2 weeks effectively raised serum 25(OH)D levels substantially, with all recipients reaching levels close to 41 ng/mL and an average increase of 15 ng/mL. There were no adverse effects, and we observed a possible benefit of a decrease in liver enzymes. No participant experienced any worsening of overall severity after beginning supplementation, but the treatment group was small (n=6).
There was an inverse correlation between BMI and change in serum 25(OH)D levels in the treatment group, consistent with previous studies that found people with higher BMIs need higher dosages of vitamin D to achieve the same blood level. 28,29
Vitamin D plays an important role in modulating the immune system in several ways. It has been shown that vitamin D can modulate both innate and adaptive immunity.30 In particular, vitamin D is believed to have anti-inflammatory properties since higher vitamin D levels are associated with low inflammatory markers, such as interleukin 6 (IL6), tumor necrosis factor alpha (TNF-α), and C-reactive protein (CRP) in a healthy population.31,32
The low levels of vitamins C, E, and A and many carotenoids (which can be converted to vitamin A) suggest a pattern of increased oxidative stress and a need for substantial increases of those nutrients to restore normal levels. In regards to CoQ10, only 1 patient was taking supplemental CoQ10, so supplementation does not explain the high level of CoQ10; we hypothesize that perhaps the body increases production of CoQ10 to respond to the infection. For vitamin K, it appears that the Covid-19 infection is causing a major decrease in K2, and hence supplementation may be beneficial. A large study found that vitamin K status was very depleted in patients with Covid-19 vs controls, but that study could not distinguish between K1 and K2 levels.33
Limitations
This pilot study has several limitations. The population size of this study was small, and a larger study is necessary to confirm the results.
With the treatment portion of the study, the sample size was very small, due to delays between onset of symptoms and enrolling participants and delays in obtaining the results of the serum 25(OH)D tests.
Although the study questionnaire was fairly comprehensive, there were a few symptoms that we did not assess, such as mental confusion/difficulty thinking, and these could be added in a future study.
Conclusions and Future Directions
The major findings of this pilot study are that low levels of serum 25(OH)D were associated with more severe Covid-19 symptoms (similar to the findings of many previous studies) and with a longer duration of symptoms, which is 1 of the first reports of that association.
Specifically, lower levels of serum 25(OH)D (<30 ng/mL) were associated with:
- Higher severity of all primary and secondary symptoms, with the results for cough and shortness of breath/difficulty breathing being statistically significant.
- Longer duration of symptoms (22 days vs 14 days, P=0.05)
- Lower rate of developing significant levels of antibodies to SARS-CoV-2
- Obesity and higher bodyweight
The small treatment arm of this pilot study found that supplementation of 10,000 IU/day for 2 weeks in participants with levels less than 30 ng/mL was safe and effective in raising levels to above 40 ng/mL.
Finally, the participants had unusually low levels of many nutrients, including vitamin C, vitamin A, and related carotenoids (lutein, zeaxanthin, beta-cryptoxanthin, alpha-carotene, beta-carotene, lycopene), and MK-7 and high levels of CoQ10 and K1. Further investigation of this is warranted.
Figure 1 Flow chart of study participants
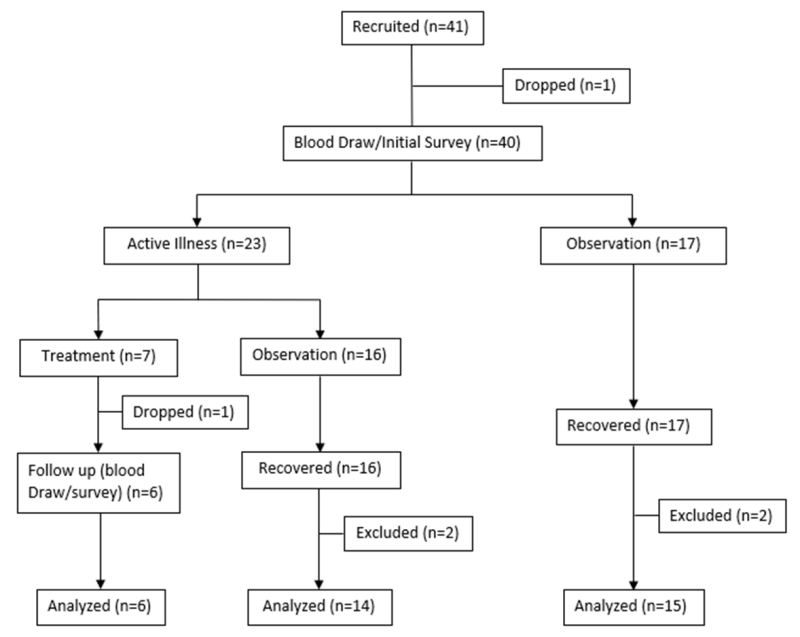
Figure 1: Flow chart of study protocol and participants. At the time of the initial symptom survey and blood draw, participants reported if they were experiencing an active illness of Covid-19 or if they had recovered. Those who had an active illness were observed for 6 weeks or until they recovered, whichever came first. All participants in the treatment study were analyzed using their initial information, and a separate subanalysis was done to understand the effects of supplementation. Therefore, most analyses included n=37 for Part 1 and n=6 for the treatment study.
Table 1: Participant demographics
Frequency | |
Gender | |
# Female | 27 (69%) |
# Male | 12 (31%) |
Age (in years) | |
18–24 | 4 (10%) |
25–34 | 13 (33%) |
35–44 | 10 (26%) |
45–54 | 9 (23%) |
55–64 | 3 (8%) |
65+ | 0 (0%) |
Race/Ethnicity | |
White/Caucasian | 24 (62%) |
Hispanic or Latino | 13 (33%) |
Black or African American | 1 (3%) |
Other | 1 (3%) |
American Indian or Alaska Native | 0 (0%) |
Asian | 0 (0%) |
Body Mass Index | |
Underweight (0–18.5) | 0 (0%) |
Normal (18.5–25) | 11 (28%) |
Overweight (25–30) | 13 (33%) |
Obesity (30–55) | 15 (38%) |
Illness | |
Active illness during study | 22 (55%) |
Hospitalized during illness | 3 (8%) |
Preexisting Medical Conditions | |
Obesity (BMI ≥ 30) | 15 (38%) |
High blood pressure | 8 (21%) |
Lung disease (pneumonia, bronchitis, adult respiratory distress syndrome [ARDS], etc.) | 5 (13%) |
Diabetes | 3 (8%) |
Autoimmune disease | 3 (8%) |
History of kidney stones | 2 (5%) |
Immune deficiency | 0 (0%) |
Pregnancy | 0 (0%) |
Cancer | 0 (0%) |
Kidney disease | 0 (0%) |
Duration of Symptoms | |
Average (days) | 19.7 ± 12.6 |
Median (days) | 17 |
Hospitalization Due to SARS Covid-19 Infection | |
# Hospitalized | 3 |
Average duration of hospital stay (days) | 6 ± 1 |
Supplemental Oxygen | |
# Needing supplemental oxygen | 2 |
Average # of days on supplemental oxygen | 5 ± 1.4 |
Vitamin D Supplementation | |
Average intake per day (IU) | 1,713 ± 2,314 |
Median intake per day (IU) | 857 |
Participants taking vitamin D supplements | 24 |
Participants not taking vitamin D supplements | 15 |
Vitamin D Blood Levels (serum 25(OH)D) | |
Average (ng/mL) | 30.3 ± 9.8 |
Median (ng/mL) | 28.1 |
Number of participants with low levels (<30 ng/mL) | 23 |
Number of participants with normal levels (≥30 ng/mL) | 16 |
Table 2: Measured (unadjusted) serum 25(OH)D levels at enrollment by range
Serum 25(OH)D levels range (ng/mL) | Number within this range (n=39) |
10–19 | 7 |
20–29 | 16 |
30–39 | 8 |
40–49 | 6 |
50+ | 2 |
Table 3: Highest severity level of symptoms for groups with low vs normal adjusted serum 25(OH)D levels. Also, correlation of adjusted serum 25(OH)D with symptom severity.
Symptom (worst overall rating of symptoms) | Correlation of symptom severity vs adjusted 25(OH)D | Average severity (low adjusted 25(OH)D) | Average severity (normal adjusted 25(OH)D) | P value (normal vs low 25(OH)D) |
Primary Symptoms | ||||
Shortness of breath/difficulty breathing | –0.36 | 1.22 | 0.50 | 0.02 |
Cough | –0.28 | 1.04 | 0.50 | 0.03 |
Pneumonia | –0.17 | 0.35 | 0.14 | 0.43 |
Bronchitis | –0.04 | 0.22 | 0.07 | 0.36 |
Secondary Symptoms | ||||
Muscle pain | –0.29 | 1.61 | 1.07 | 0.11 |
Fatigue | –0.25 | 1.78 | 1.43 | 0.32 |
Chills | –0.23 | 1.00 | 0.57 | 0.10 |
Hallucination | –0.20 | 0.09 | 0.00 | 0.16 |
Blue skin on fingers and toes | –0.17 | 0.04 | 0.00 | 0.33 |
Sore throat | –0.17 | 0.70 | 0.43 | 0.23 |
GI problems: abdominal pain | –0.15 | 0.30 | 0.21 | 0.68 |
Loss of taste/smell | –0.14 | 1.83 | 1.57 | 0.55 |
Repeating shaking with chills | –0.12 | 0.55 | 0.21 | 0.19 |
Headache | –0.10 | 1.78 | 1.64 | 0.71 |
Loss of appetite | –0.10 | 1.00 | 0.57 | 0.19 |
GI problems: constipation | –0.08 | 0.22 | 0.07 | 0.32 |
GI problems: diarrhea | –0.01 | 0.74 | 0.64 | 0.76 |
Worst overall illness severity | –0.09 | 1.96 ± 1.0 | 1.79 ± 1.1 | 0.65 |
Table 4: Levels of nutrients in participants compared to the laboratory reference range and (in some cases) compared to the median of the group used to establish the reference range.
Test | Average | Standard Deviation | Median of Group Used to Establish the Reference Range | Reference Range | % Below Reference Range | % Above Reference Range |
Zinc (µg/dL) | 77.6 | 12.2 | 77 | 56–134 | 0% | 0% |
Vitamin C (mg/%) | 0.6 | 0.5 | 1.6 | 0.9–2.9 | 93% | 0% |
Vitamin A (Retinol) (mg/L) | 0.6 | 0.6 | 0.8 | 0.63–1.15 | 58% | 3% |
Vitamin E (mg/L) | 13.63 | 8.95 | 24.95 | 12.5–37.4 | 58% | 3% |
Lutein (nmole/L) | 79.8 | 44.6 | 855 | 380–1,330 | 100% | 0% |
Zeaxanthin (nmole/L) | 48.7 | 20.9 | 175 | 80–270 | 95% | 0% |
Beta Cryptoxanthin (nmole/L) | 108.9 | 55.8 | 410 | 110–710 | 58% | 0% |
Alpha-Carotene (nmole/L) | 21.7 | 25.7 | 495 | 130–860 | 98% | 0% |
Beta-Carotene (nmole/L) | 149.1 | 190.7 | 1,600 | 600–2,600 | 95% | 0% |
Alpha-Lycopene (nmole/L) | 16.2 | 12.6 | 345 | 120–570 | 100% | 0% |
Beta-Lycopene (nmole/L) | 163.7 | 112.3 | 325 | 110–540 | 38% | 0% |
Total Carotenoid (μg/100 mL) | 28.9 | 24.0 | | | | |
Coenzyme Q10 (mg/L) | 1.4 | 1.3 | 0.9 | 0.6–1.2 | 3% | 65% |
K1 (ng/L) | 1,775.1 | 1,234.6 | 764.0 | 400–1,200 | 18% | 53% |
MK-4 (ng/L) | 49.5 | 36.6 | | | | |
MK-7 (ng/L) | 126.8 | 90.4 | 6,222.0 | 1,500–11,400 | 88% | 0% |
MK-8 (ng/L) | 6.2 | 4.9 | | | | |
MK-9 (ng/L) | 36.4 | 32.1 | | | | |